• Home
  • Landing
  • Generic
  • Elements
  • Learn More
  • Log In

Hi, I'm Jocelyn Shek!

I'm a senior at Harvard University and a student data journalist. Most recently, I interned in data reporting and graphics at The Minnesota Star Tribune and NBC News. On campus, I write for The Harvard Crimson and served as president of Harvard's student data journalism group, the Harvard Open Data Project.

Jocelyn's Photo
  • Email
  • GitHub
  • LinkedIn
résumé ↗
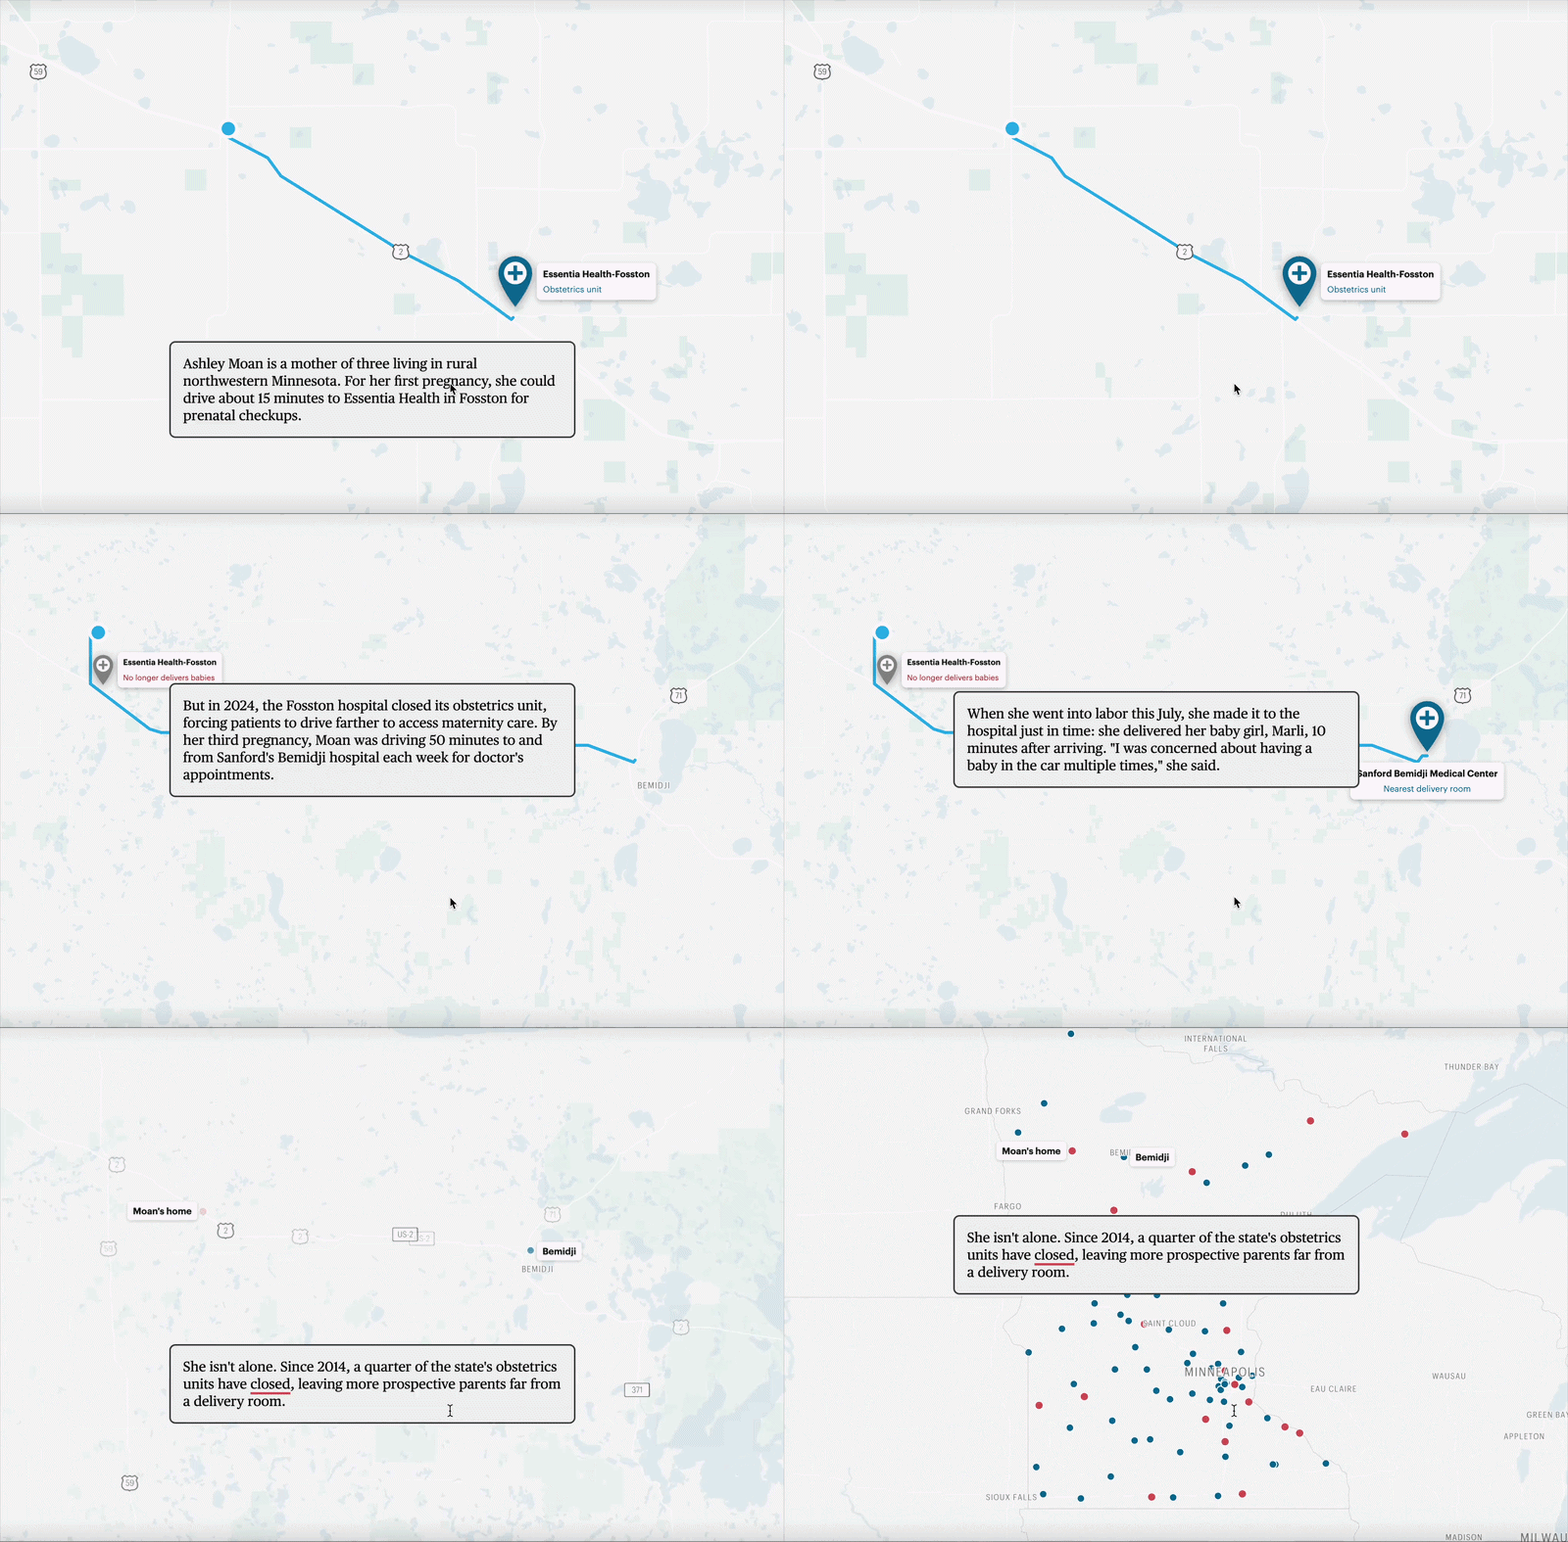
Animated map of a drive to the Essentia Health-Fosston obstetrics unit

Data analysis · Mapping · Scrollytelling

Minnesota's disappearing delivery wards leave pregnant patients far from care

The Minnesota Star Tribune

  • Conducted geospatial drive-time analysis of Minnesota's obstetrics closures using QGIS scripts and Census data, which guided reporting and interviewing
  • Designed and built responsive, animated hero map that follows one mother's drive as the reader scrolls

QGIS · Svelte
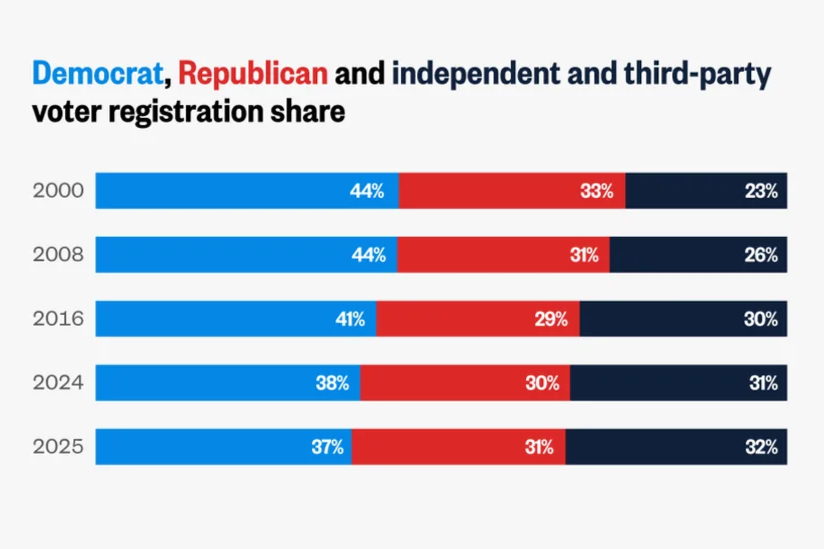
Bar chart of party registration shares

Data analysis · Reporting

Independent and third-party voter registration growing, largely at the expense of Democrats

NBC News

  • Cleaned and analyzed messy voter registration datasets in Python to uncover long-term growth in independent and third-party registration
  • Reported the political implications through interviews and exit-poll analysis; built graphics in D3 and Datawrapper

Python (pandas) · Datawrapper · D3

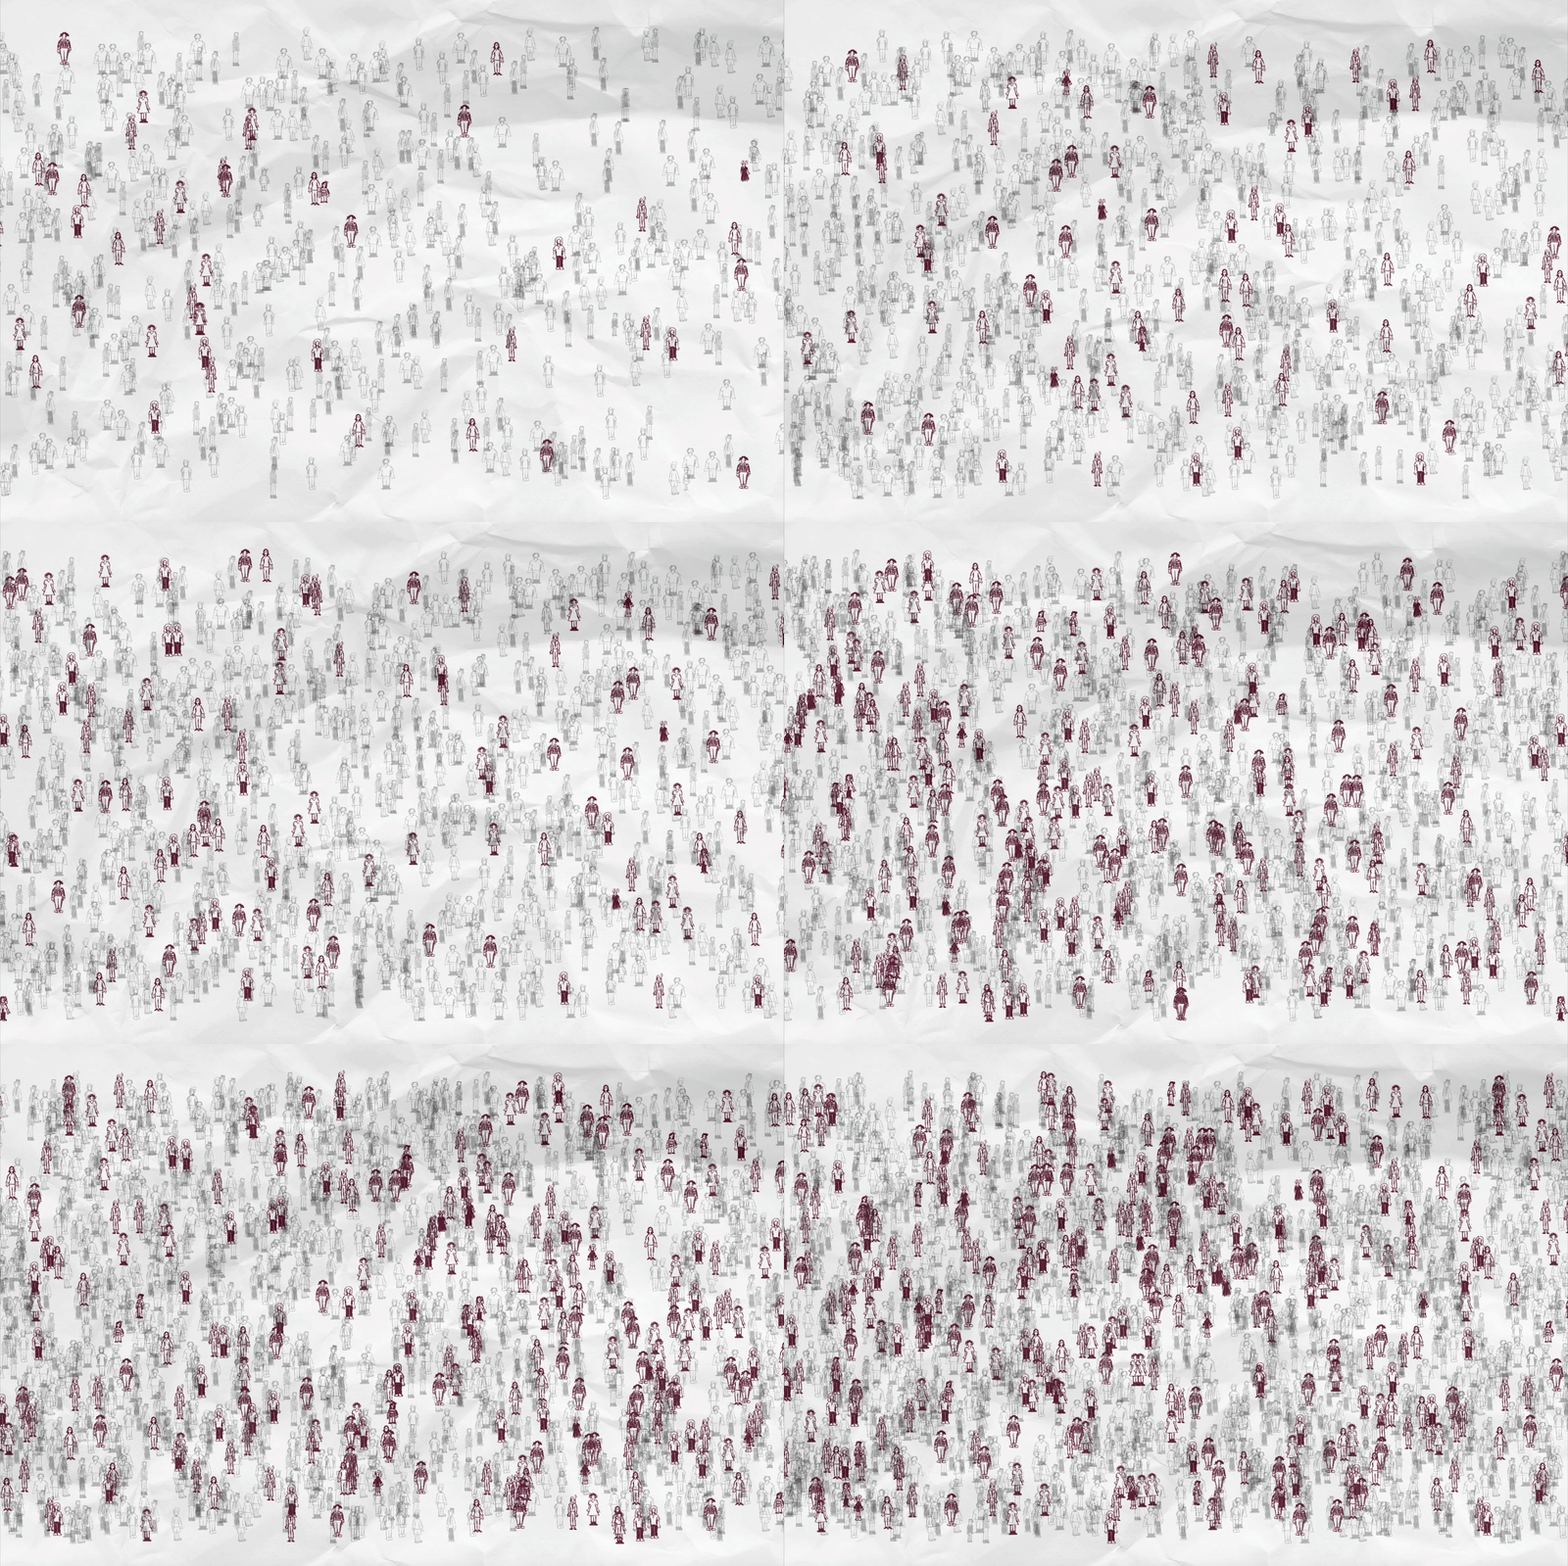
The Disappearing Act project thumbnail
The Pudding Cup (2025)
Honorable Mention

Interactive development · Design

The Disappearing Act: The Human Cost of U.S. Immigration Enforcement

  • Co-created piece visualizing the impact of immigration enforcement, using D3 and custom graphics to build a narrative interactive scrollytelling piece
  • Led narrative organization, data analysis, and scrollytelling development
  • Used human-scale visuals to contextualize ICE detention and deportation records

D3 · JavaScript

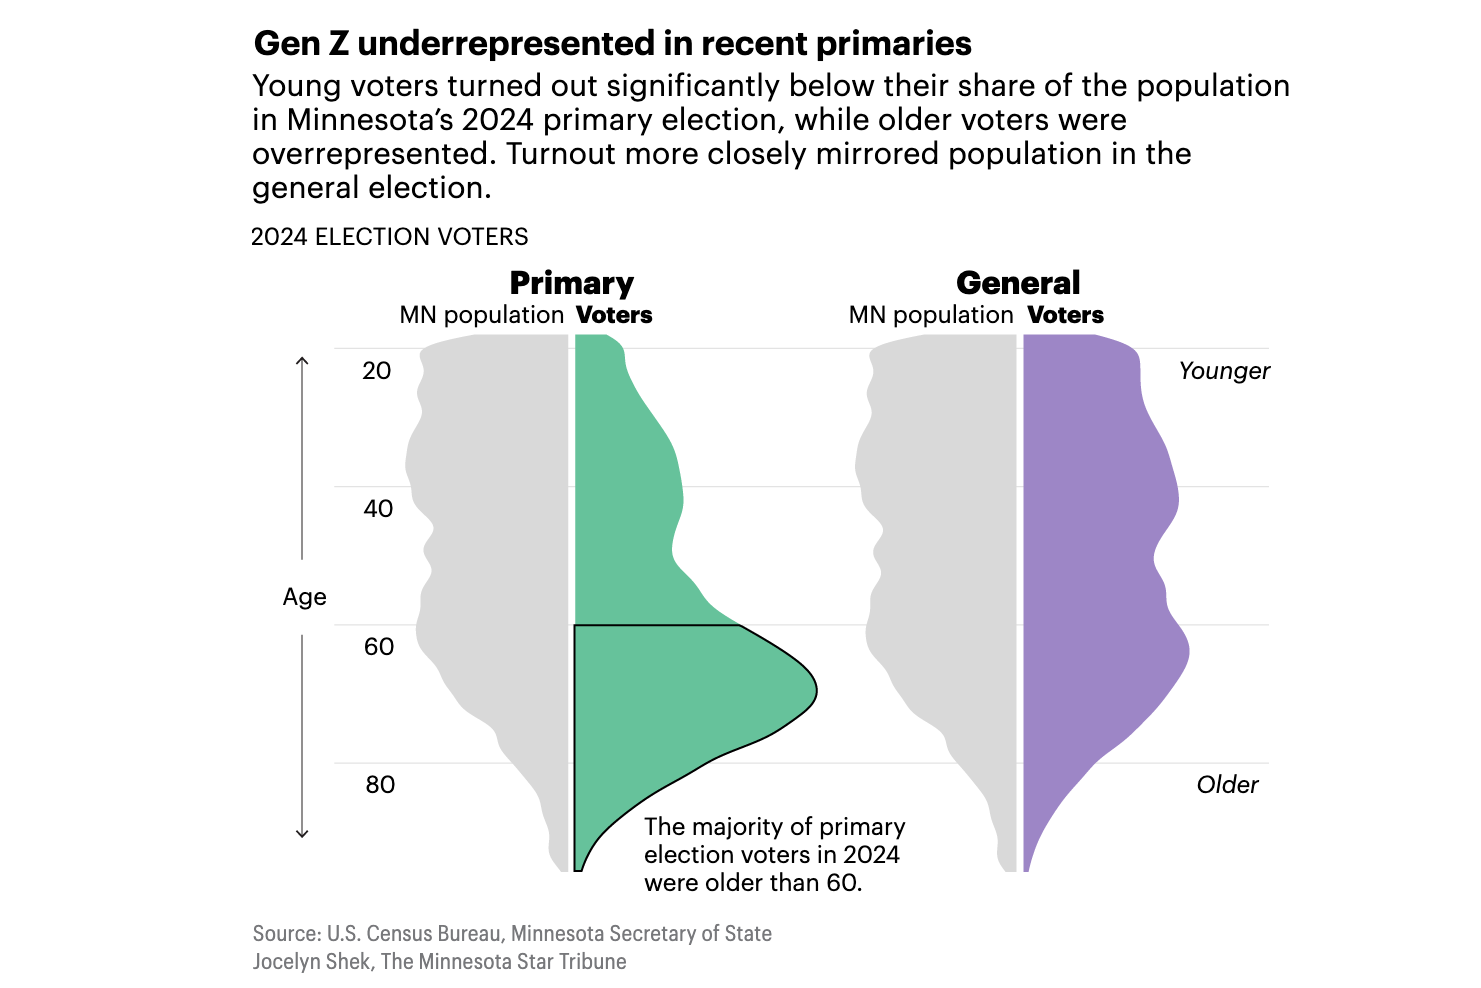
Population pyramids comparing primary and general election voters

Data analysis · Reporting

Primary turnout gives older Minnesotans more influence over November ballot

The Minnesota Star Tribune

  • Analyzed bulk voter data in Python to reveal disparities in Minnesota primary voting turnout by age group
  • Wrote the story and designed graphic using RAWGraphs, Illustrator, and ai2html
  • Interviewed politicians, students, scholars, and voter engagement activists

Python · Illustrator · ai2html

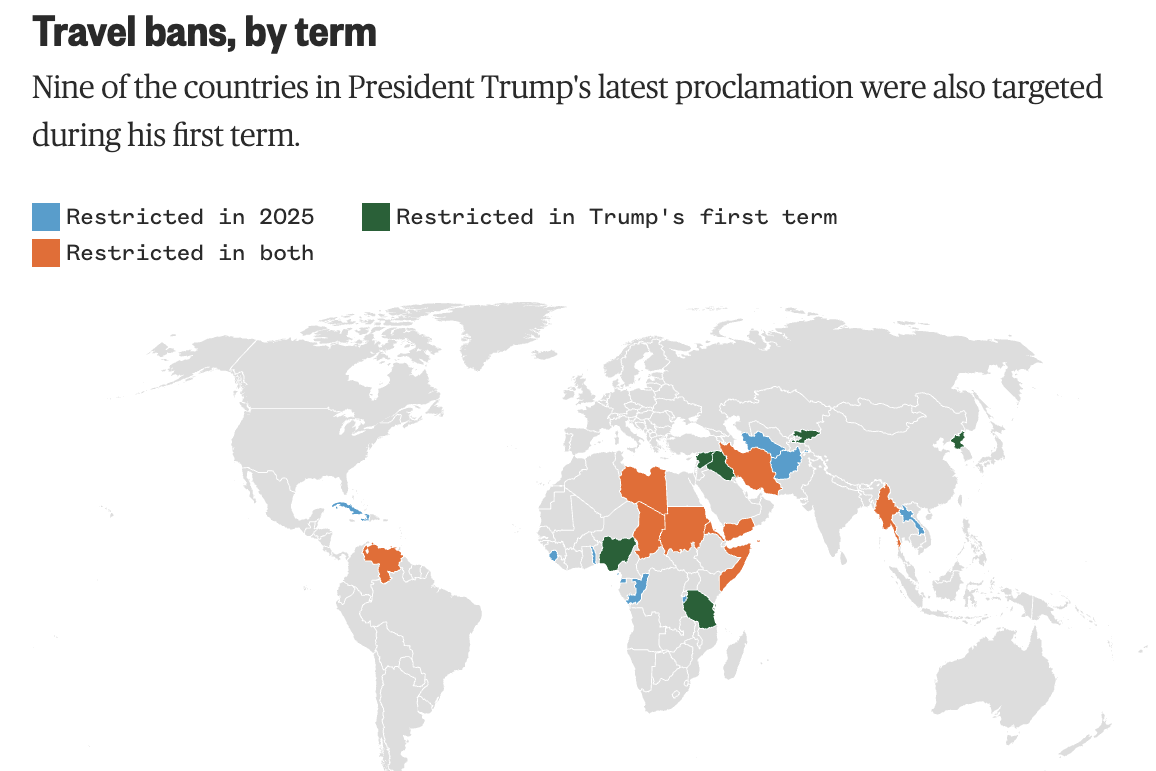
Map of countries affected by the travel ban

Data analysis · Charts · Breaking news

Five charts that show how many people President Trump’s travel ban will affect

NBC News

  • Turned around breaking news graphics, including the global map featured across NBC’s digital reporting and social media coverage, within an hour and a data analysis of State data within one day of the ban's announcement
  • Conducted fast-turnaround research, sourced relevant datasets, and developed four of the five graphics for this article

Python · Datawrapper

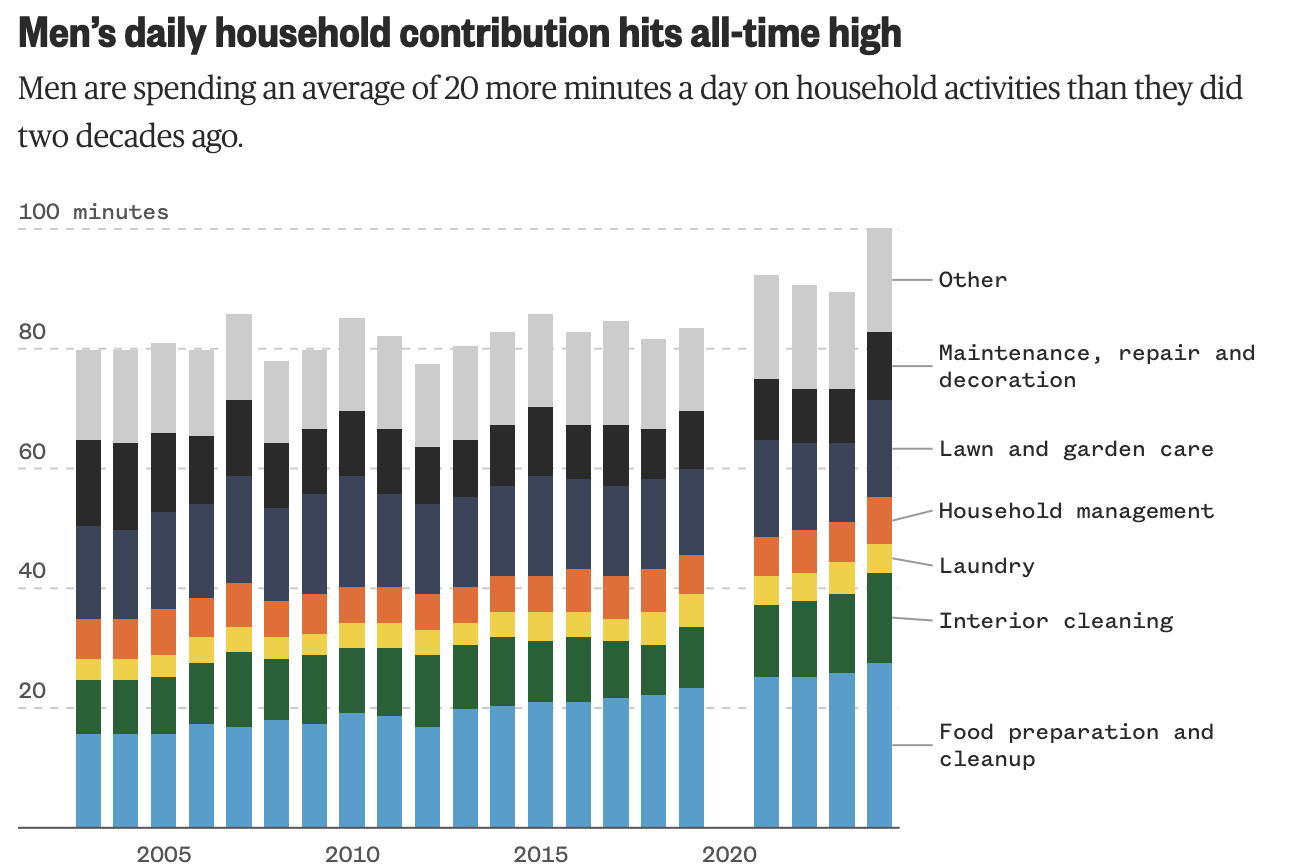
Stacked bar chart of men's daily household work

Data analysis · Reporting

U.S. men are contributing to household work more than ever

NBC News

  • Pitched story after identifying a trend in men’s growing household contributions in newly released American Time Use Survey data
  • Reported story and interviewed sociologists; conducted analysis in Python and built graphics in Datawrapper

Python · Datawrapper

The Minnesota Star Tribune

  • Primary turnout gives older Minnesotans more influence over November ballot Data reporting

    Analyzed voter data to reveal disparities in Minnesota primary voting turnout

  • Do private schools win more championships? Recent history says yes. Data analysis

    Constructed historical database of high school sports results and analyzed trends in public and private school performance by sport

  • Minnesota's disappearing delivery wards leave pregnant patients far from care Data analysis

    Conducted geospatial analysis to map and measure impact of obstetrics closures

  • Who decides which Minnesota lands get a second life? Explainer

NBC News

  • Independent and third-party voter registration growing, largely at the expense of Democrats Data reporting
  • Five charts that show how many people President Trump’s travel ban will affect Data reporting
  • The Vaccine Divide: Behind the data Methodology

    Played significant role in collecting data for NBC's long-term investigation of falling vaccination rates

  • U.S. men are contributing to household work more than ever Data reporting

    Pitched and reported story about how men's share of housework has grown, while still lagging behind women's, using American Time Use Survey data

  • Dog attacks on mail carriers reach 7-year high, Postal Service data shows Data reporting

    Analyzed U.S. Postal Service data on dog attacks on mail carriers. Led to spin-off coverage by NBC affiliate stations

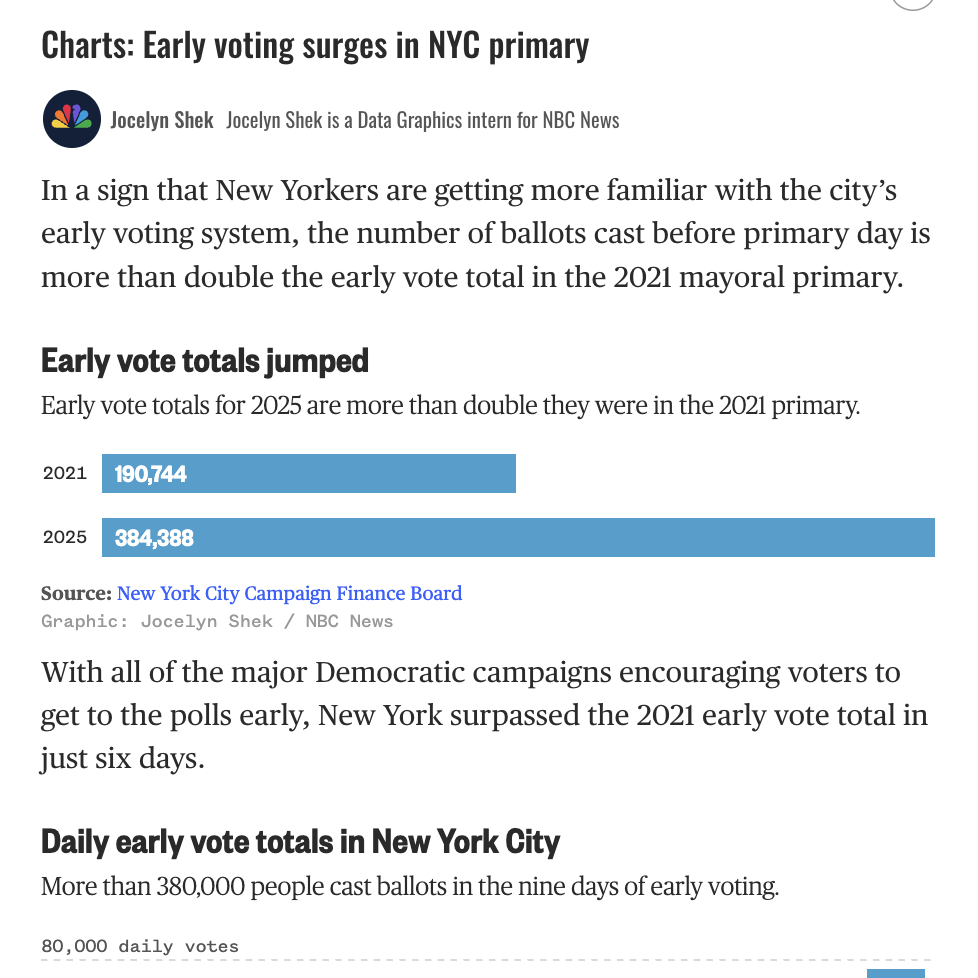
  • Early voting surges in NYC primary Data reporting

    Contributed to NBC News live blog of NYC mayoral election coverage.

The Harvard Crimson

  • Growing Older and Wiser in Cambridge Investigative feature

    Narrative investigation about how rising costs, housing policy, and community groups shape life for older adults in Cambridge

  • The Theory, Born at Harvard, That Could Remake Right-Wing Jurisprudence Investigative feature

    Investigative piece about common-good constitutionalism, a conservative legal theory that started at Harvard Law

Map thumbnail

Minnesota's disappearing delivery wards leave pregnant patients far from care

The Minnesota Star Tribune

Map thumbnail

The Disappearing Act: The Human Cost of U.S. Immigration Enforcement

The Pudding Cup 2025 - Honorable Mention

Map thumbnail

U.S. men are contributing to household work more than ever

NBC News

Story thumbnail

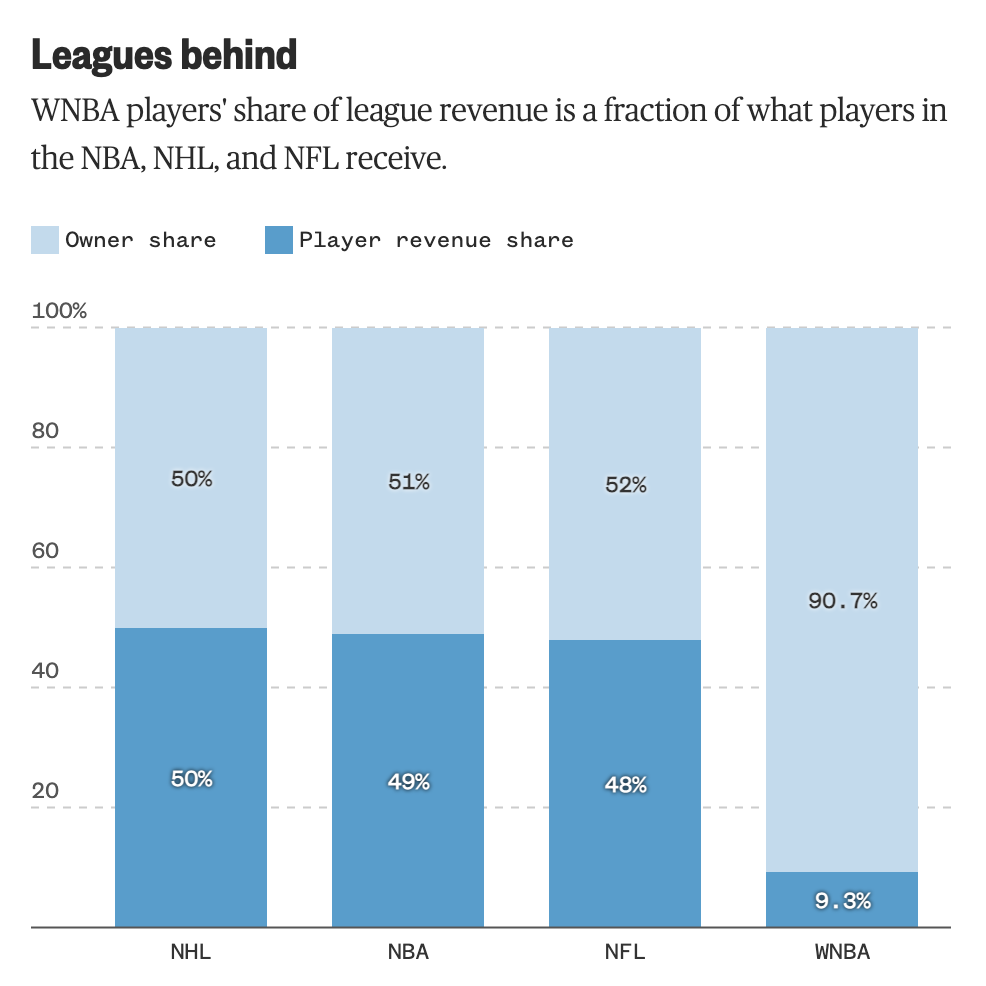
Sports leagues' player shares

Visualization / NBC News

Story thumbnail

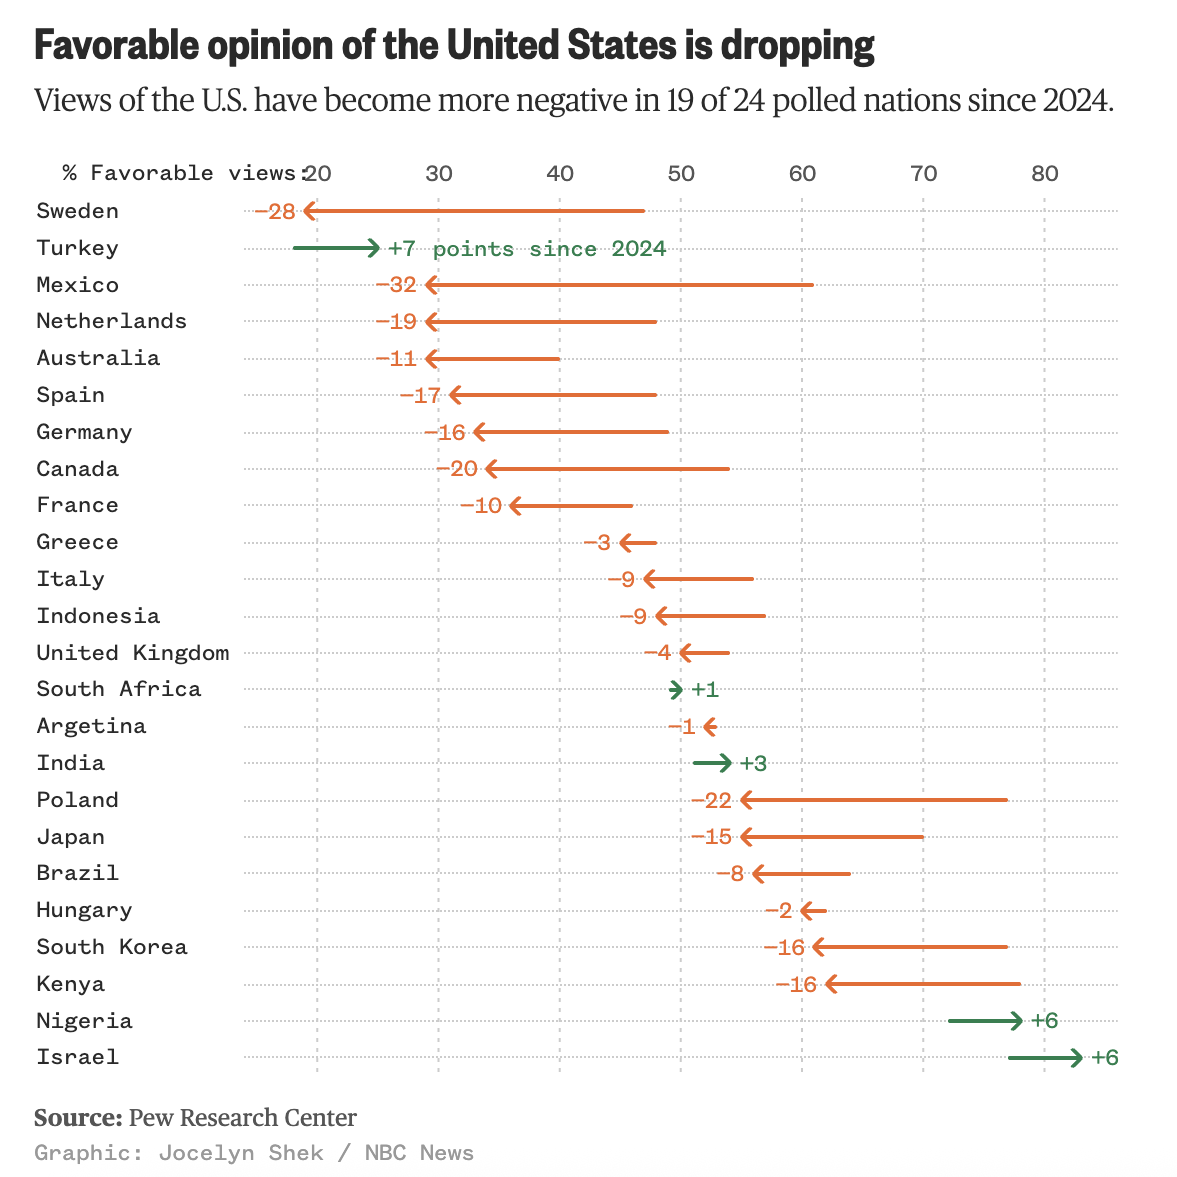
Views of the United States

Visualization / NBC News

Story thumbnail

Supreme Court gifting

Visualization

Story thumbnail

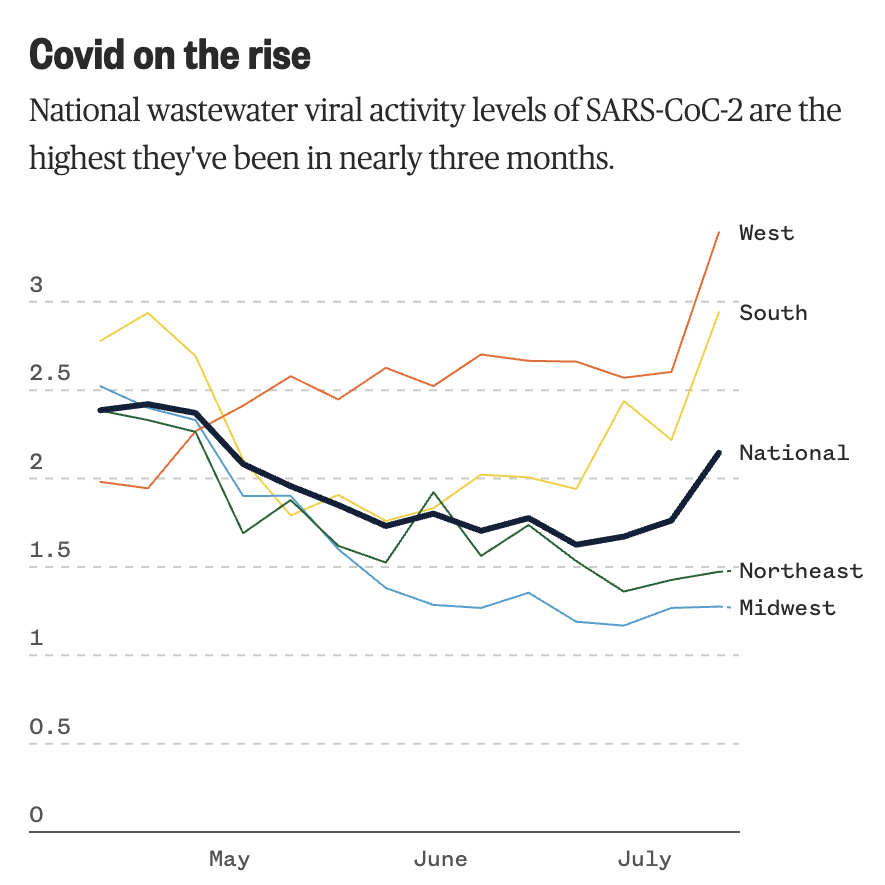
Covid's prevalence in wastewater

Visualization / NBC News

Story thumbnail

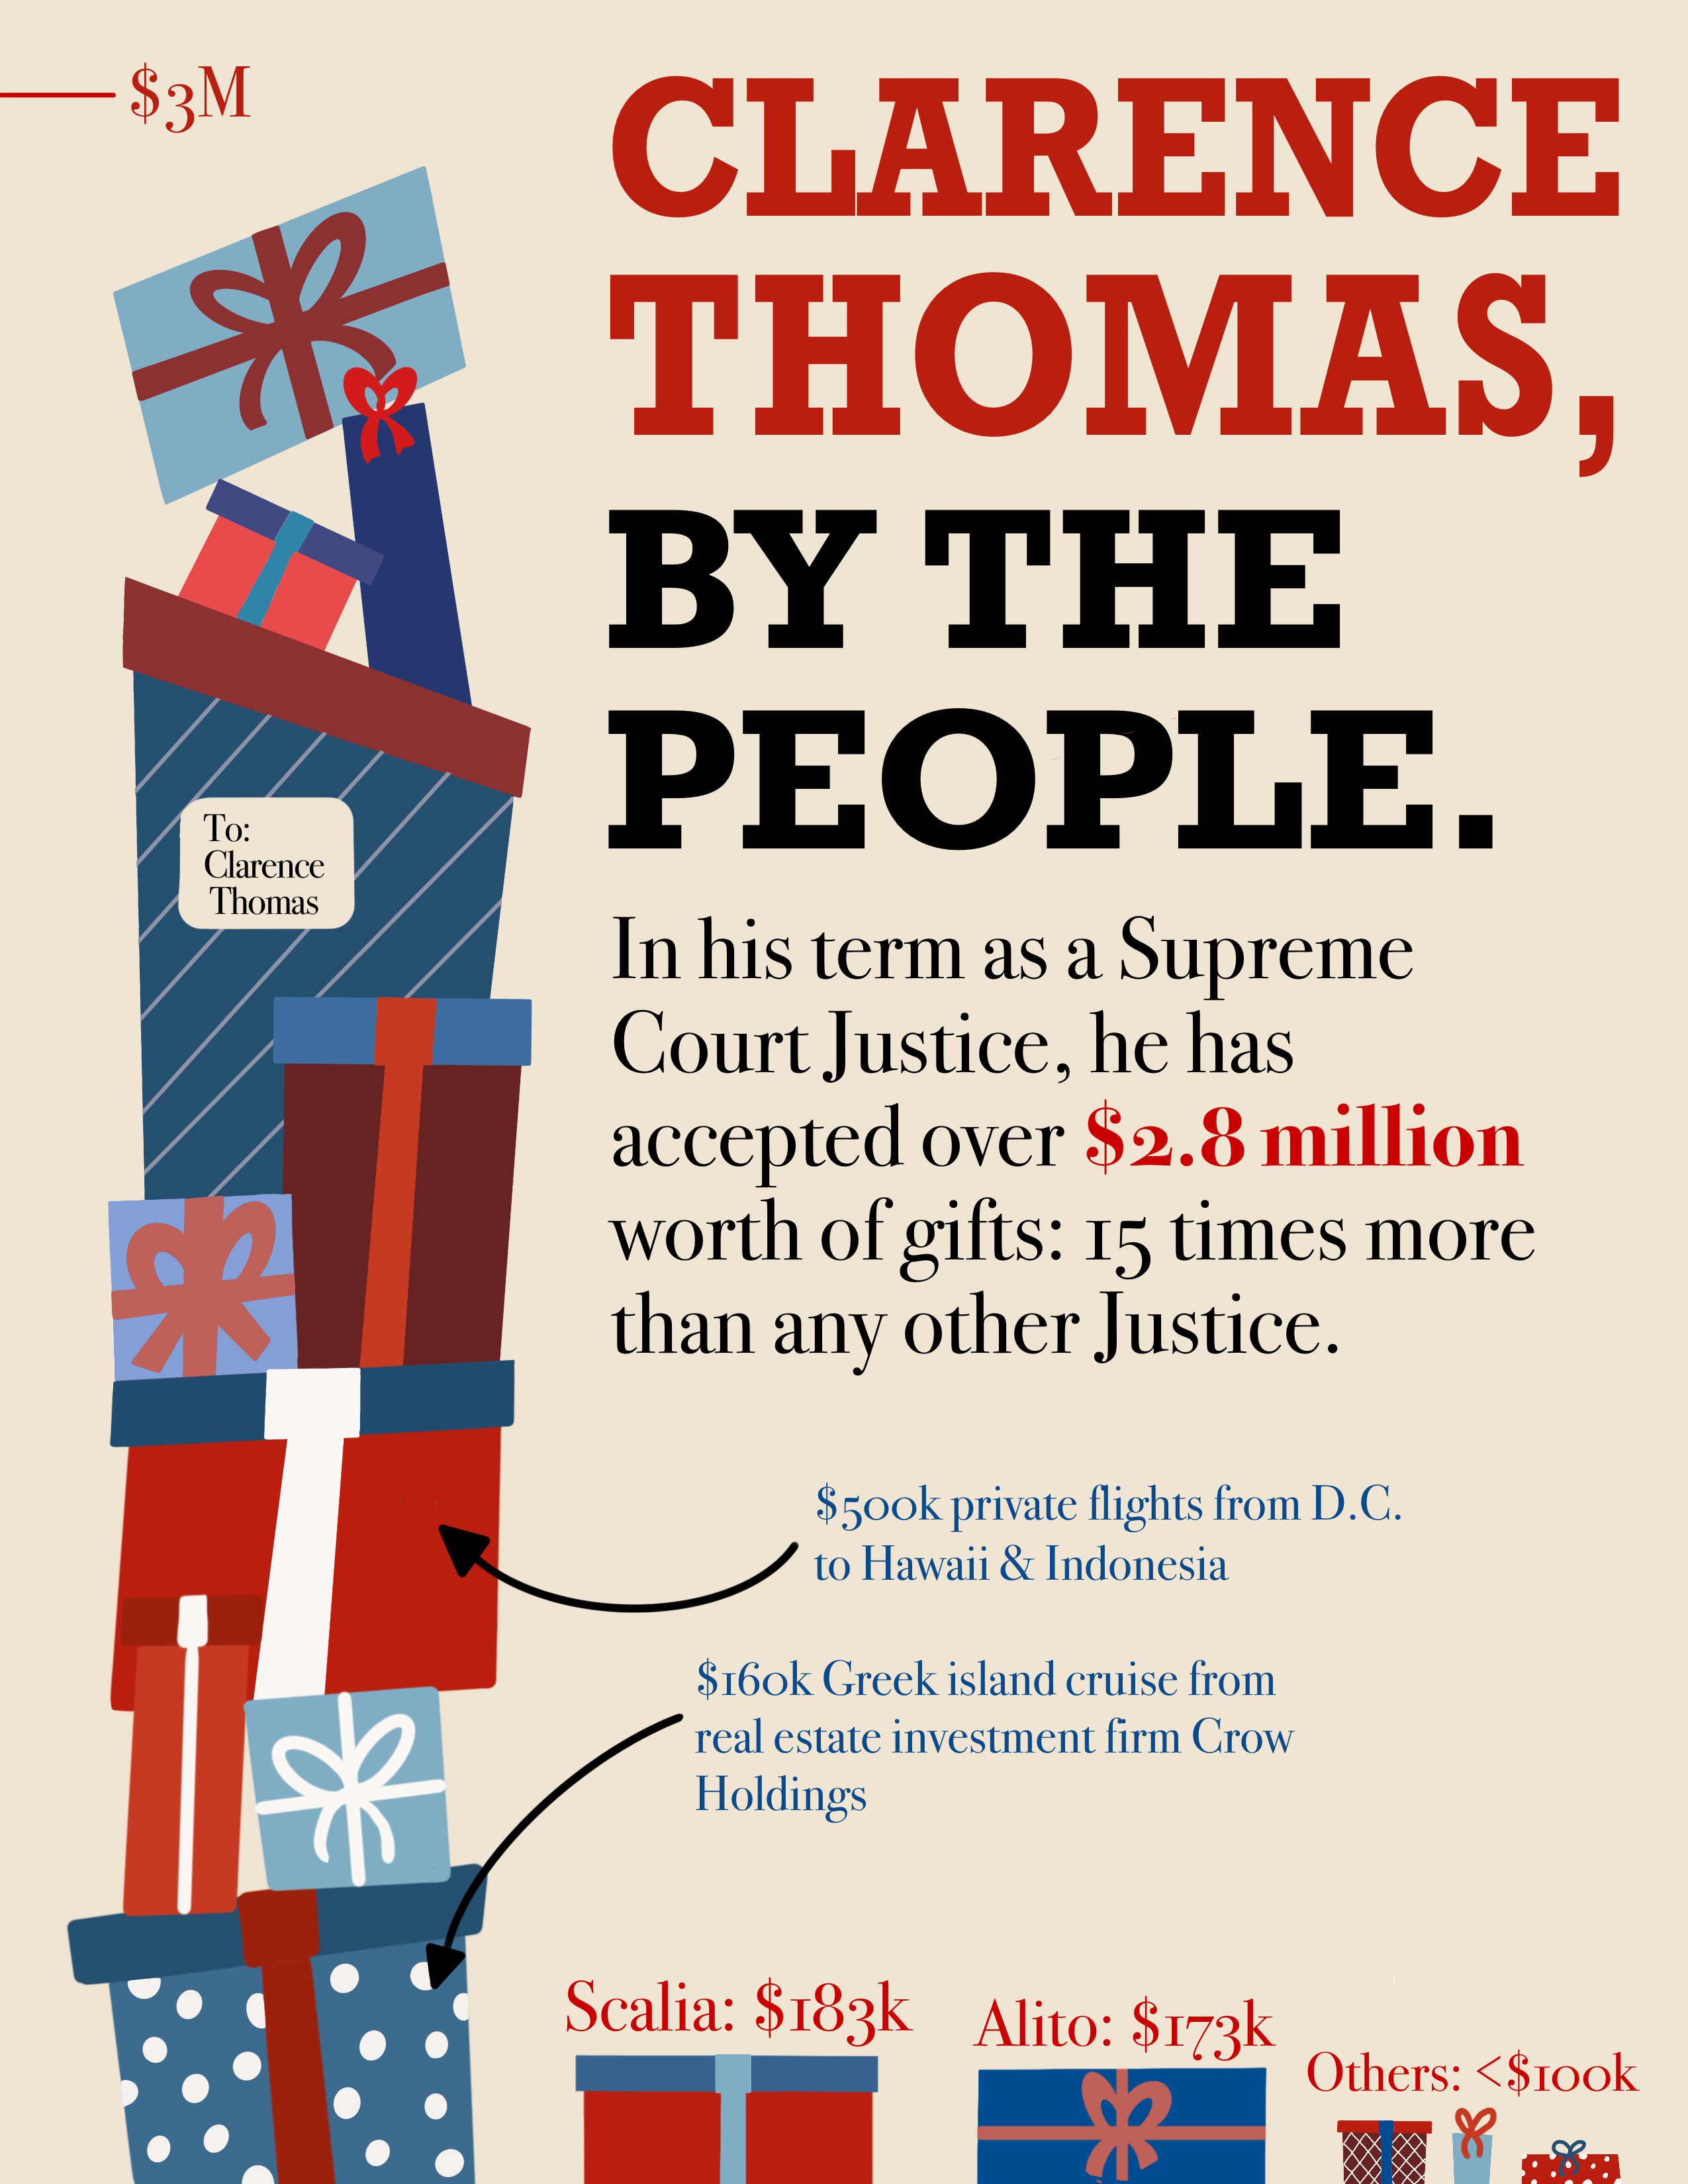
Justice Thomas's gifts

Visualization / CS 73

Story thumbnail

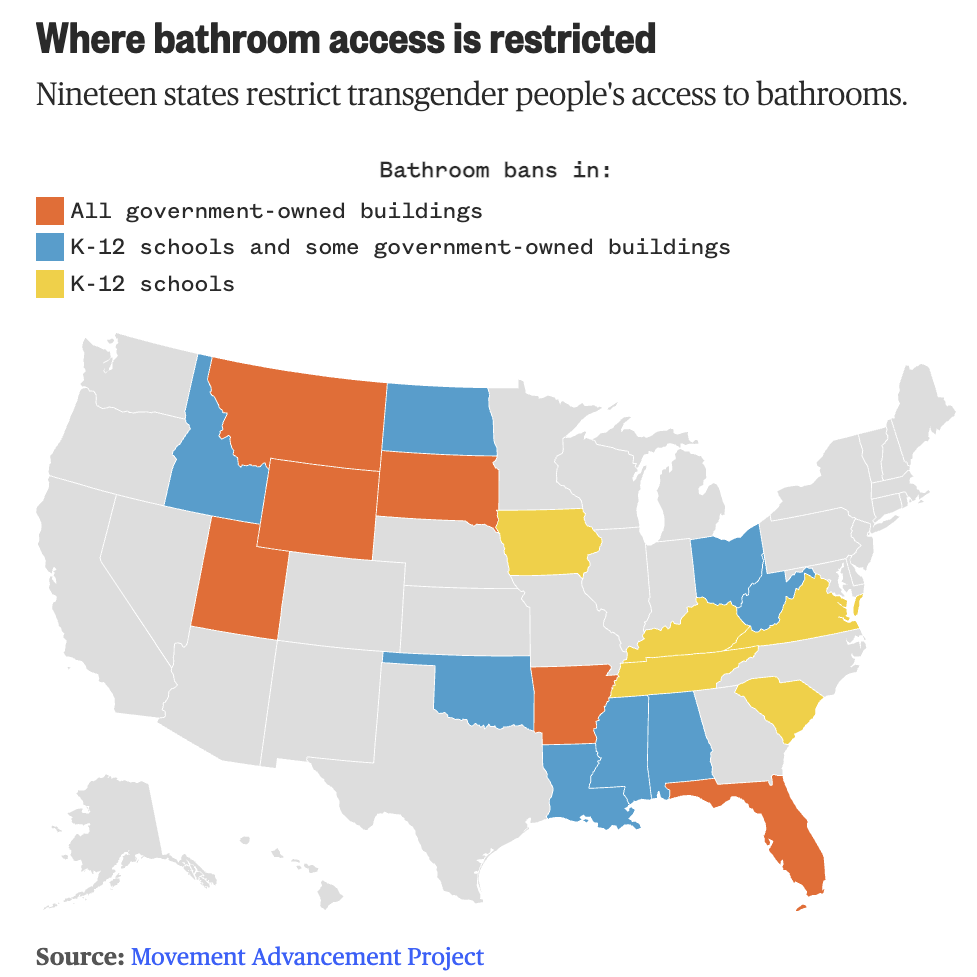
Restrictions on bathroom access

Visualization / NBC News

NYC primary early voting

Early voting surges in NYC primary

Visualization and Reporting / NBC News

Story thumbnail

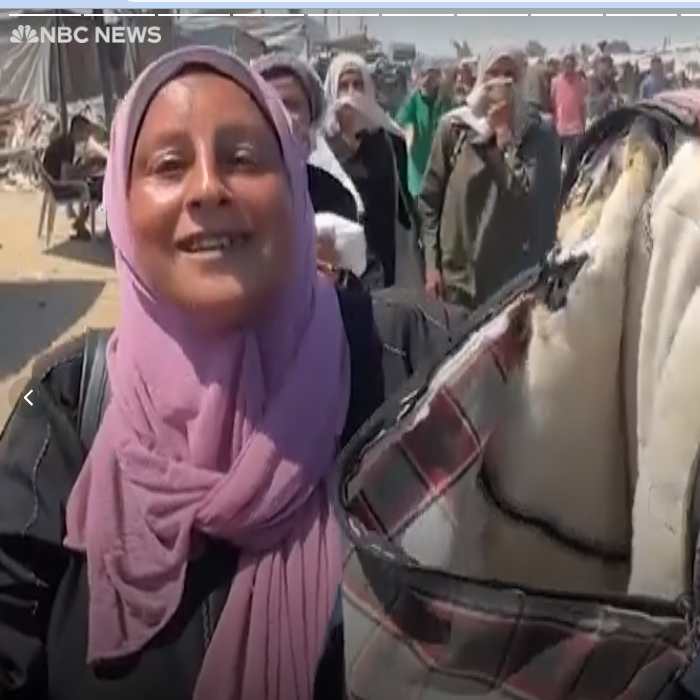
Violence at GHF aid sites

Development / NBC News

Story thumbnail

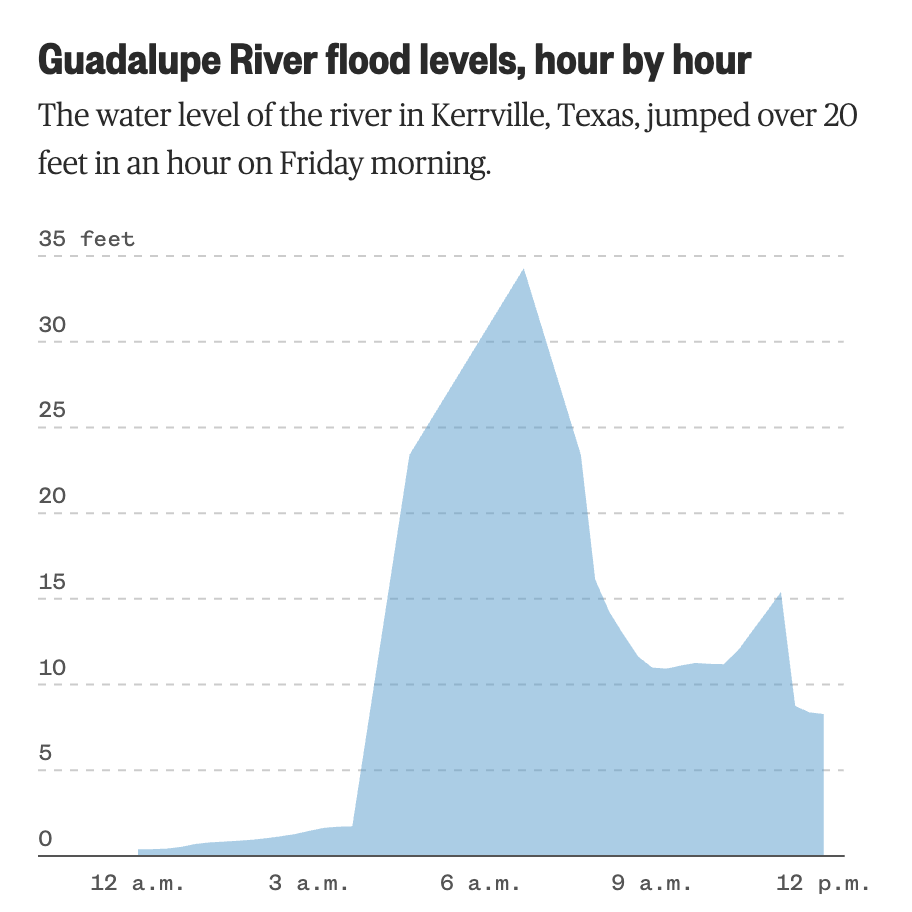
Kerrville flood levels

Visualization / NBC News

Story thumbnail

Ideological polarization in Congress

Visualization / CS73

Story thumbnail

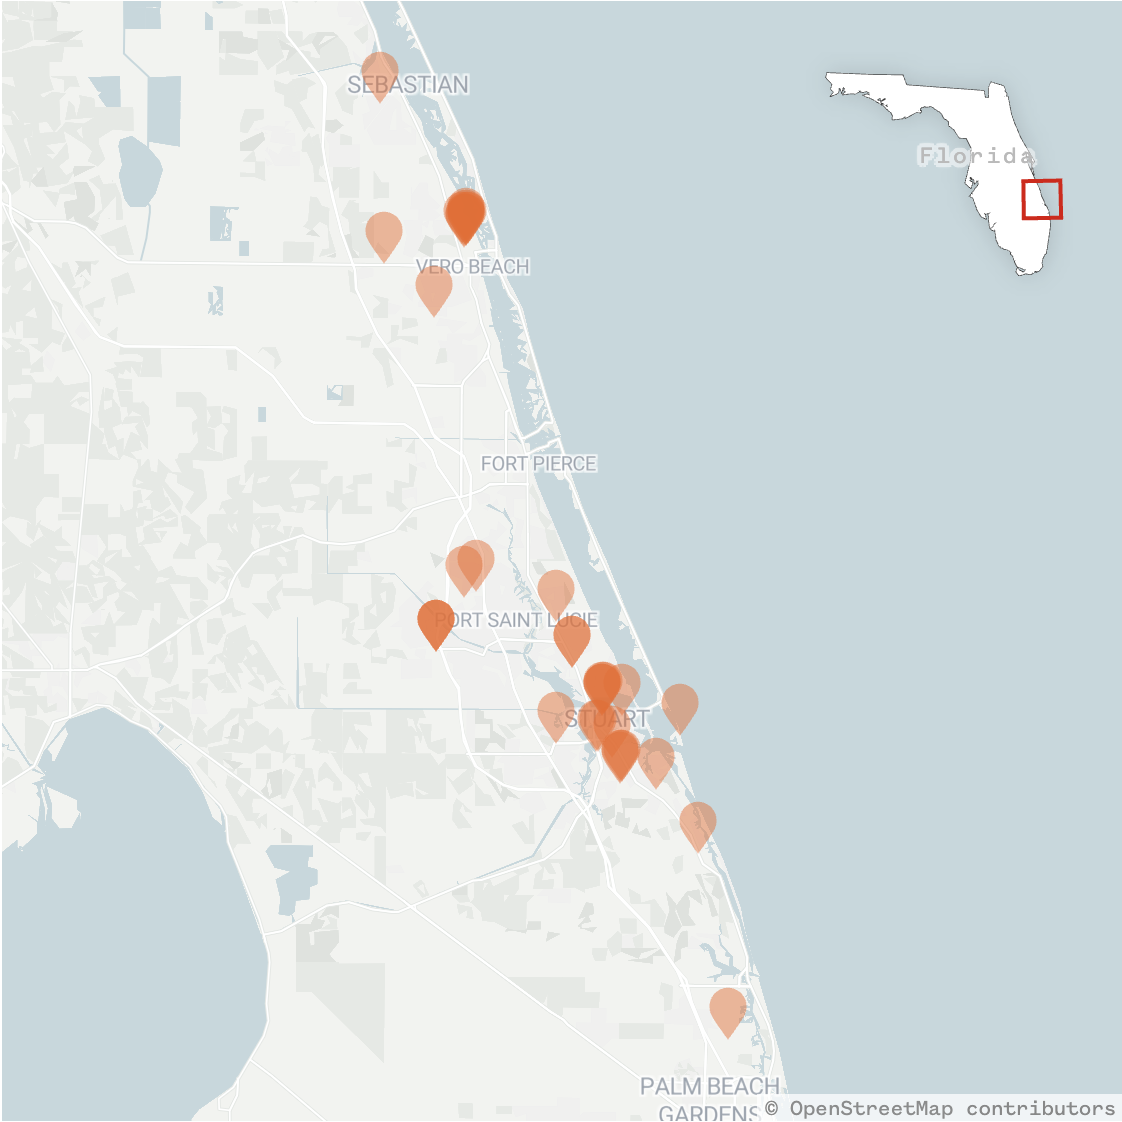
Cleveland Clinic's expansion into Florida

Visualization / NBC News

Story thumbnail

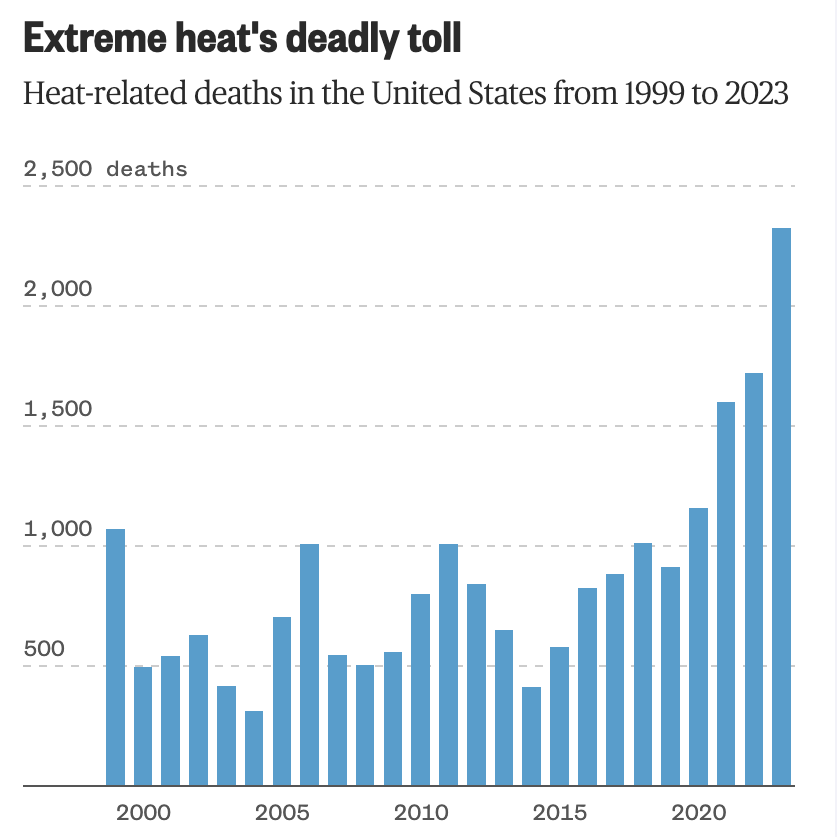
Extreme heat's deadly toll

Visualization / NBC News

Story thumbnail

Weekly news quiz

Development / NBC News

Story thumbnail

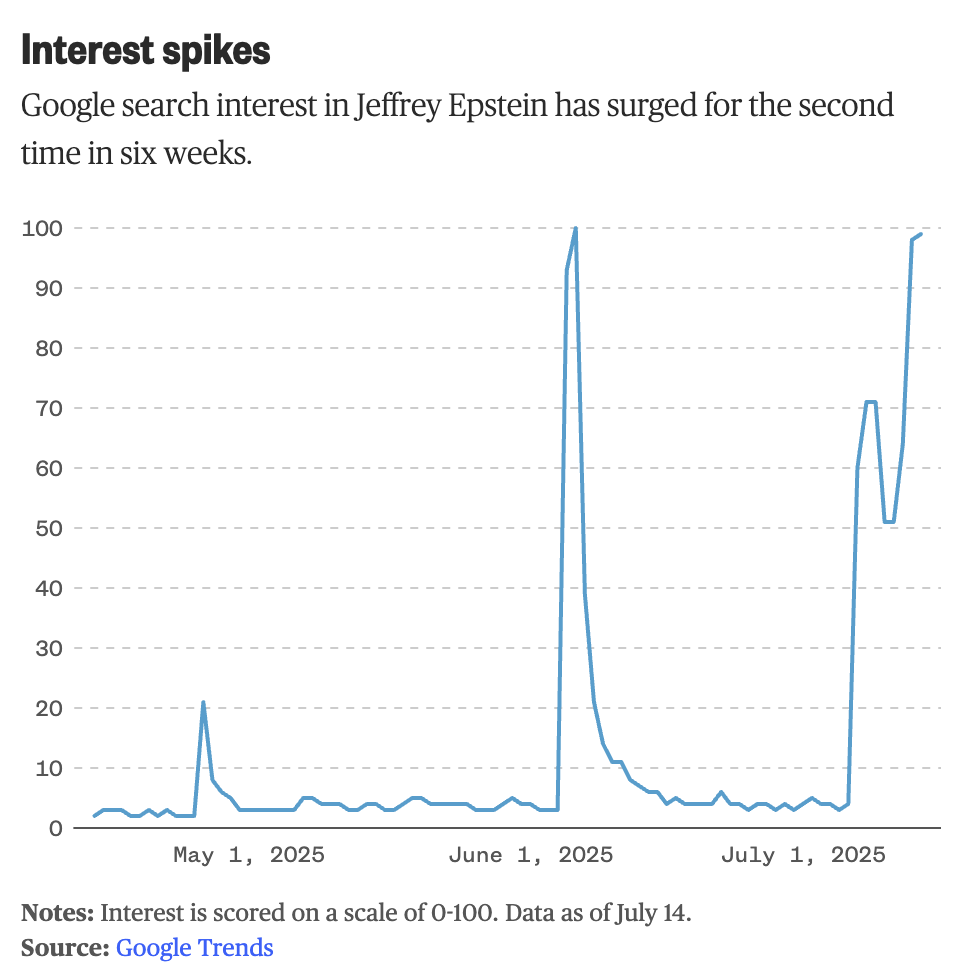
Search interest in Jeffrey Epstein

Visualization / NBC News

Story thumbnail

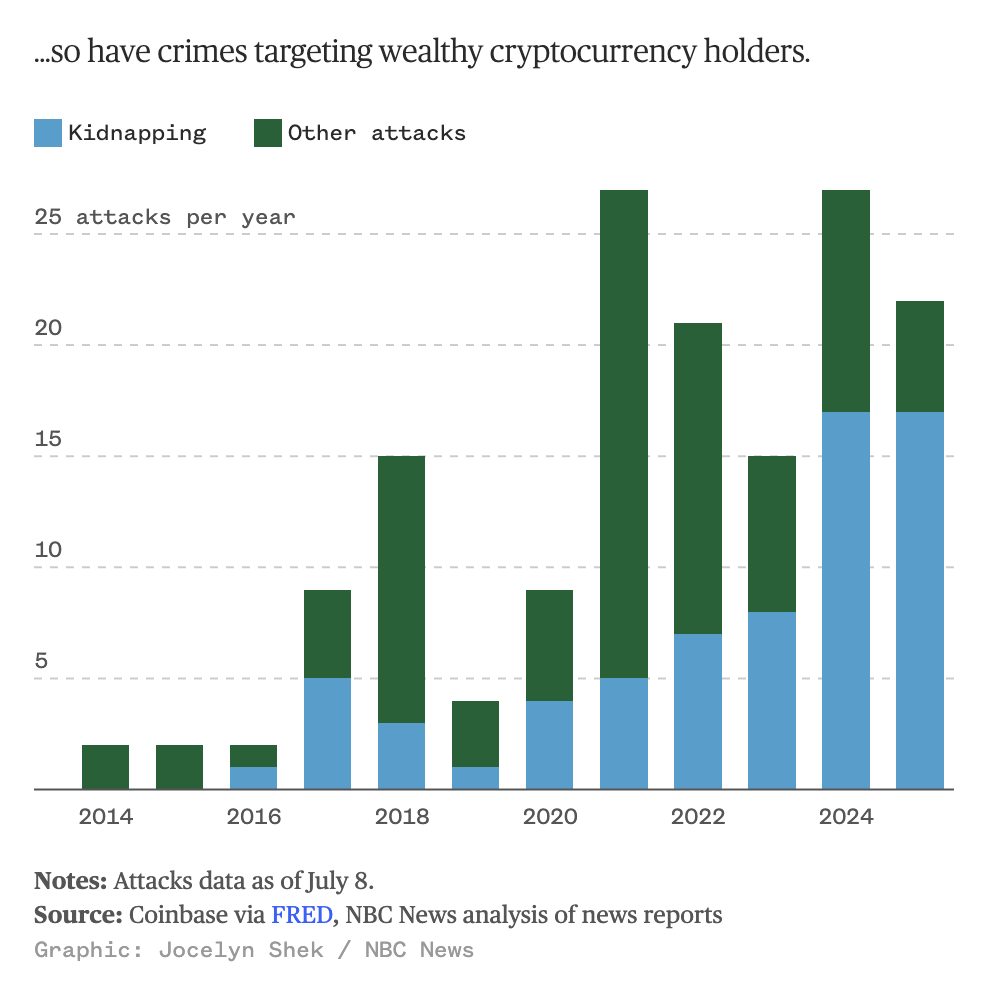
Crypto attacks

Visualization / NBC News

I'm a senior at Harvard University studying sociology and statistics. Basically, I'm passionate about understanding people and the systems that shape everyday life through data! A lifelong storyteller, I came to college planning to study theater (though am still heavily involved!), but fell in love with uncovering human experiences through a new medium: journalism. With a background in quantitative social science research, I care about making rigorous social analysis legible to wider audiences through rich reporting and engaging visuals.

Skills

  • Interactive development: HTML, CSS, JavaScript (D3, p5)
  • Data analysis: Python (pandas), R, SQL
  • Visualization: Datawrapper, Flourish
  • Design: Figma, Illustrator
  • Other: Git, QGIS, Tableau, Looker Studio, Excel, Google Sheets

Interests

  • Urban policy and infrastructure
  • Demography and census data
  • Education
  • Elections & political behavior
  • Public health & health equity